SATs and the Single Family Home
I’ve been teaching classes on home-buying for years and always talk about the tight positive relationship between perceived school quality and single-family homes prices. Here, using data from the US Census (American Community Survey), the MA Department of Education, and the MLS (Multiple Listing Service) I’ve visualized the data using a free data visualization tool called Tableau Public.
There a lot happening in this graph.
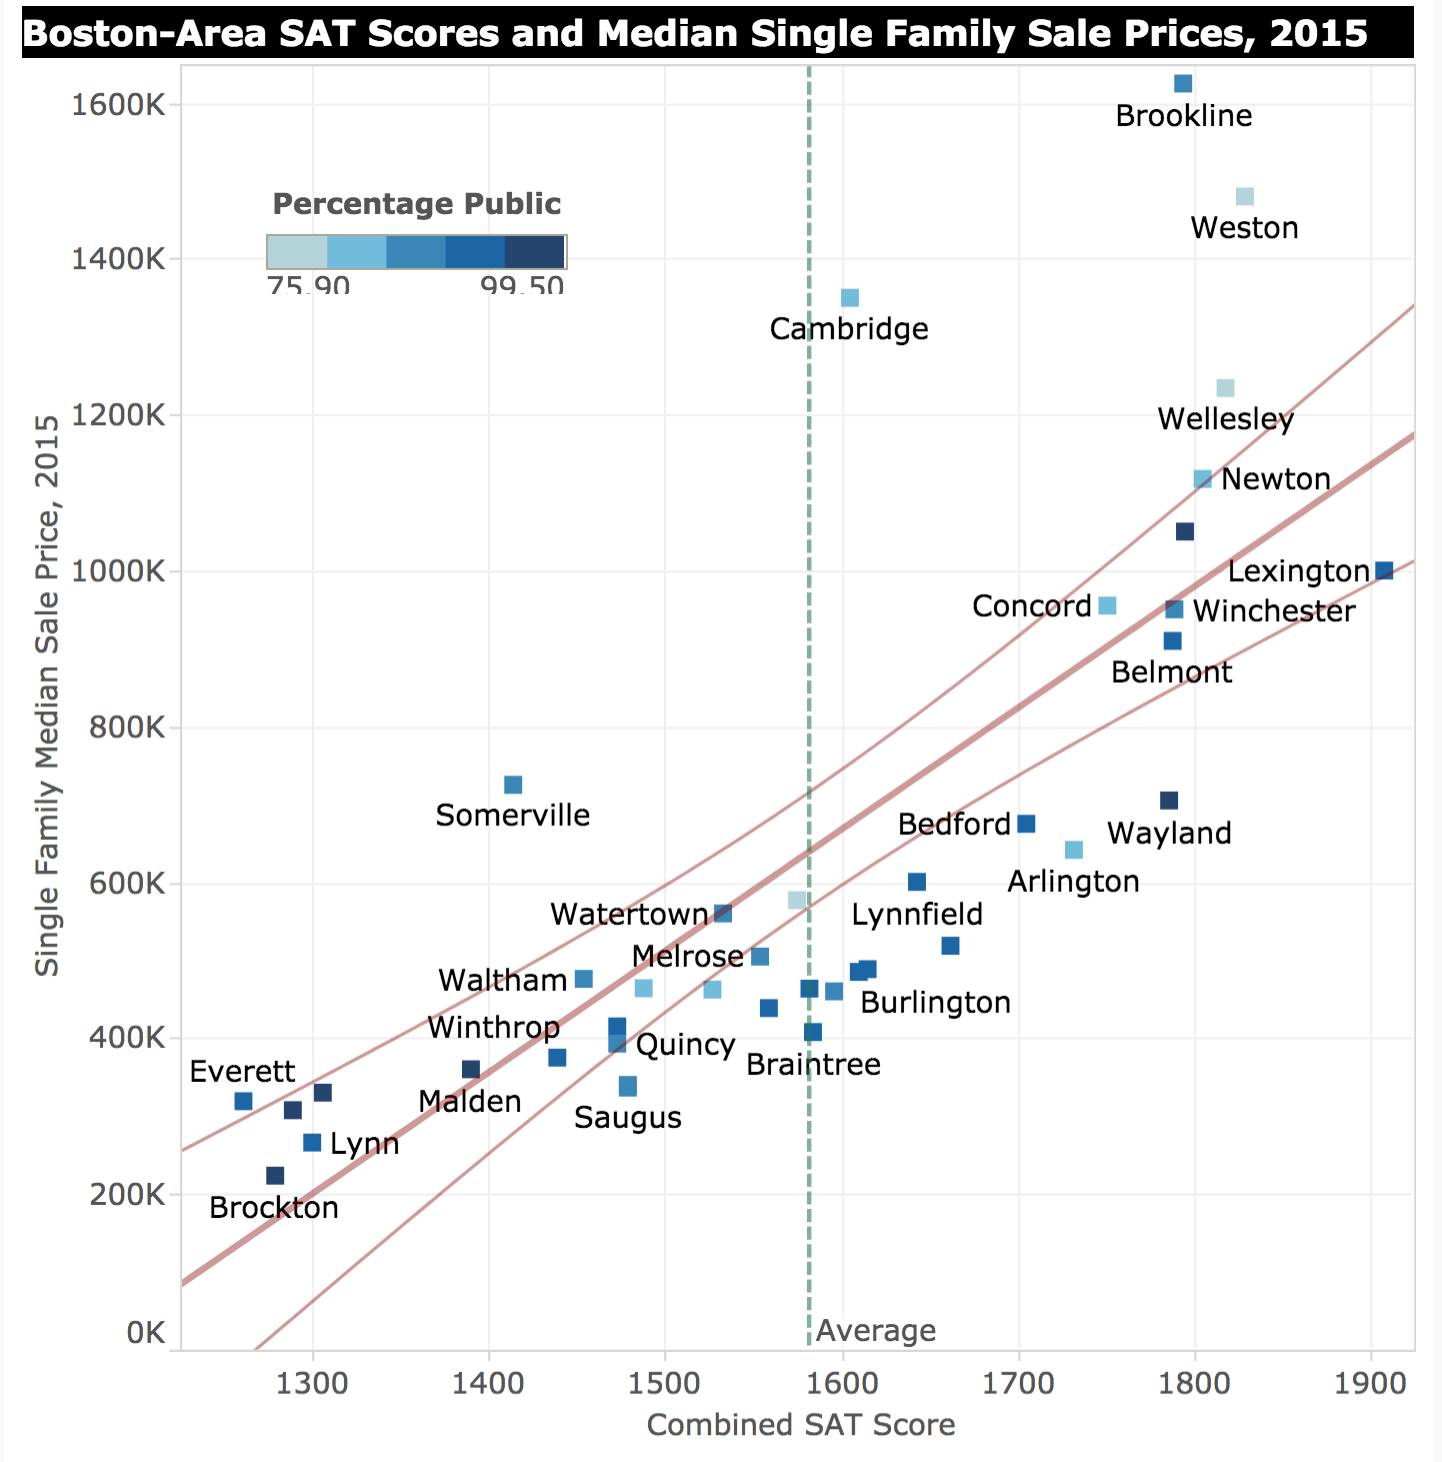
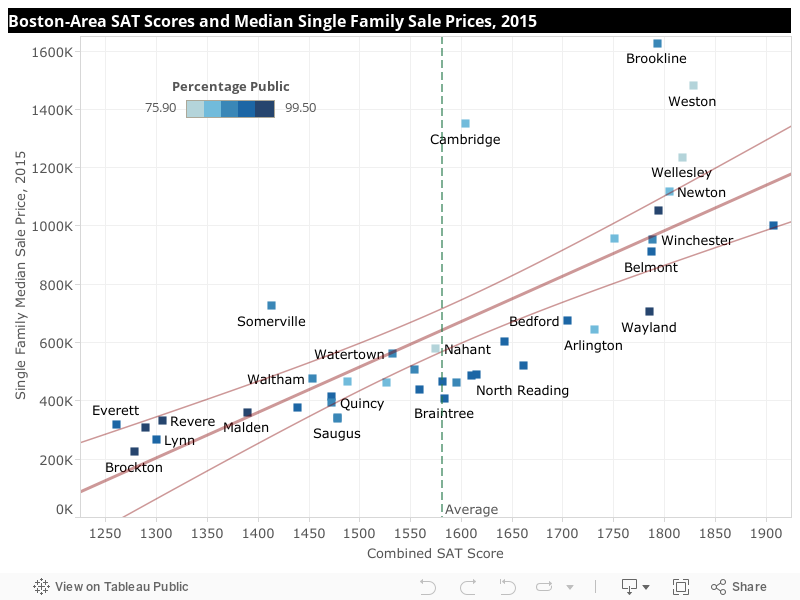
1) First, you can see (from the look of the data and the regression line) that there is a strong positive relationship between school quality (as measured by combined SAT scores) and median single family home prices.
2) You’ll also see that there are some outliers: Somerville, Cambridge, and Brookline have single family home prices that are far higher than their combined SAT scores demand. These are urban communities that have relatively few single family homes (relative to condos) and that have amenities (proximity to work, cultural venues and conveniences) that go way beyond the school systems. Weston and Wellesley are also outliers, having home prices well above the line.
3) If you’re looking for value you’ll want to look for homes that are farther away from and to the right of the trend line, for homes that have higher SAT scores and lower-than-trendline single family home prices. Wayland is a standout here, with combined SAT scores approaching 1800 and single family home prices about $200k below its closest competitor, Belmont. Arlington, Bedford, and Burlington are also standouts here, having higher-then-average SAT scores and average or lower-than-average single family home prices.
Wayland stands out as the highest-value community, if you’re looking for strong SAT scores and (relatively) affordable single family home prices.
4) A final factor to look at is public school attendance. The dots indicating each town are colored based on the percentage of students who attend public school. You’ll notice that public school attendance per town ranges from just under 76% (in Nahant) to almost 100% (in Lincoln). In the high-SAT band, Wellesley and Weston stand out as having well-above trendline home prices and just 80% of students attending public school, while Lexington and Belmont have about 90% and Lincoln (as mentioned above) almost 100% public school attendance. In the lowest SAT band, 93% + of student attend public school.